Copilot chatGPT Wartime analysis

Here are the key highlights from the ongoing Russia-Ukraine conflict:

  1. **Recent Attacks**: Russia launched a massive drone and missile attack on eastern Ukraine, targeting residential areas. In Kryvyi Rih, a missile strike resulted in 14 fatalities, including six children, and injured over 50 people.
  2. **Diplomatic Tensions**: Ukrainian President Volodymyr Zelenskyy condemned Russia’s actions, stating that diplomacy seems ineffective against such aggression. He urged Western nations to increase pressure on Russia.
  3. **NATO Involvement**: NATO foreign ministers gathered in Brussels to discuss defense spending and support for Ukraine. Simultaneously, military chiefs met in Kyiv to strategize on Ukraine’s defense capabilities.
  4. **Ceasefire Challenges**: While there are informal ceasefires in certain areas, Russia has intensified its attacks, stalling peace negotiations.
  5. **Global Reactions**: The US has issued warnings to Moscow, emphasizing the urgency of peace talks. Meanwhile, Poland scrambled warplanes to ensure its airspace safety amid heightened missile threats.

The situation remains critical, with ongoing violence and diplomatic efforts struggling to make progress. Let me know if you’d like a deeper dive into any specific aspect.


Here are the key highlights from the ongoing USA-China trade war:

  1. **Escalation of Tariffs**: The United States has imposed tariffs of up to 104% on Chinese goods, marking a significant escalation in the trade conflict. In retaliation, China has increased tariffs on US goods to 84%, further intensifying tensions.
  2. **Economic Impact**: The trade war has disrupted global markets, with stock indices experiencing volatility. Economists are raising concerns about the potential for a global recession due to these aggressive tariff measures.
  3. **Trade Deficit**: The US-China trade deficit continues to grow, with the US importing $438.9 billion worth of goods from China in 2024, while exporting only $143.5 billion.
  4. **China’s Response**: China has released a white paper emphasizing the mutual benefits of trade and criticizing the US’s protectionist policies. It calls for dialogue and cooperation to resolve the conflict.
  5. **Global Reactions**: The trade war is causing ripple effects across the world, with countries like India being urged by China to join hands against the US’s tariff actions.

The situation remains tense, with both nations showing no signs of backing down. Let me know if you’d like to explore any specific aspect further!


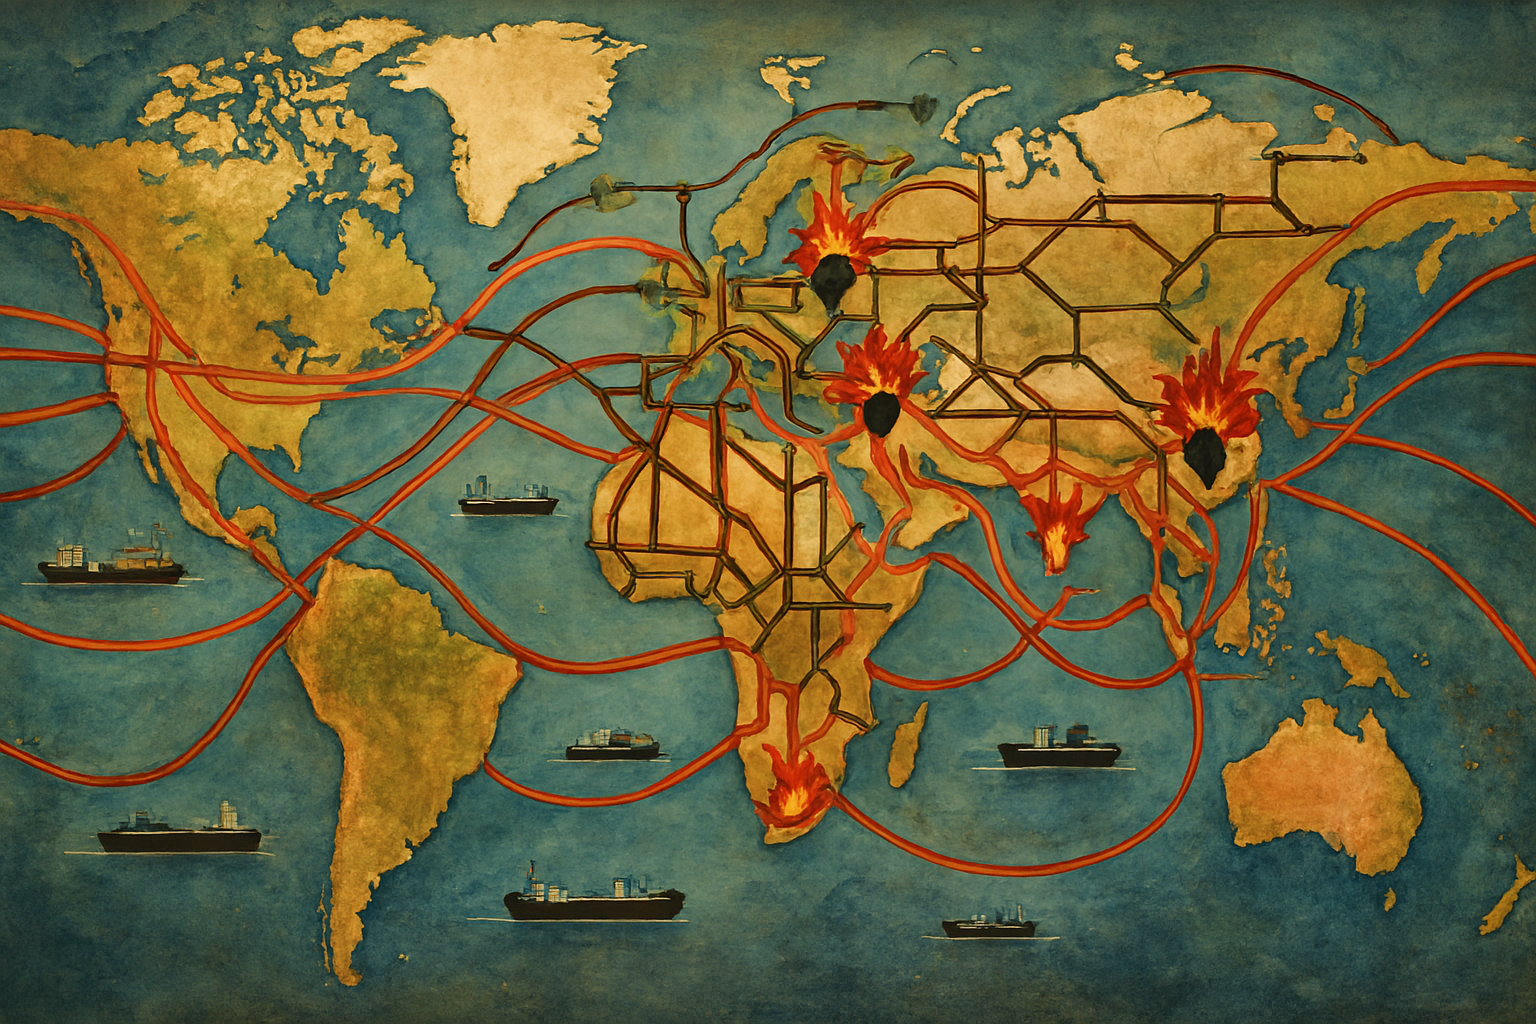
In situations where digital networks are down during wartime, acquiring goods will rely on more traditional methods of exchange and adaptability. Here are some approaches to consider: Continue reading “Copilot chatGPT Wartime analysis”

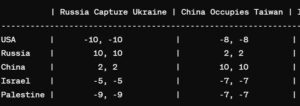
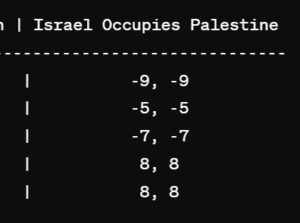
Chatgpt : Payoff matrix for Rus Vs Ukr, China vs taiwan, Israel vs palestine

Creating such a comprehensive analysis would be beyond the scope of what I can provide, especially in the time constraints of a single response. However, I can offer a simplified version of what you’re asking for.

### Most Exported Goods and Services:
1. Goods: Electronics, automobiles, machinery, petroleum products, pharmaceuticals.
2. Services: Financial services, tourism, IT services, consulting.

### Potential Bottlenecks:
1. Economic disparity leading to social unrest.
2. Resource competition (water, oil, rare earth minerals).
3. Territorial disputes.
4. Ethnic and religious tensions.
5. Political instability and failed states.

Hypothetical Triggers for Conflict:
1. Aggressive territorial expansion (e.g., Russia-Ukraine conflict).
2. Violent regime changes (e.g., Myanmar, Venezuela).
3. Proxy wars fueled by major powers (e.g., Syria, Yemen).
4. Ideological conflicts (e.g., North-South Korea).
5. Resource scarcity leading to competition (e.g., disputes in the South China Sea).

### Allies and Enemies:
Alliances are complex and constantly evolving. They often depend on shared interests, historical ties, and strategic considerations. Some hypothetical alliances might include:

1. Allies: NATO countries, EU member states, US allies in Asia (Japan, South Korea, Australia), GCC countries, ASEAN nations.
2. Potential Enemies: Russia, China (in certain scenarios), North Korea, Iran, non-state actors like terrorist organizations.

### Market Reactions:
Major events like conflicts or regime changes can impact markets in various ways:

1. **Stock Markets:** Uncertainty often leads to volatility. Military conflicts or political instability in key regions can lead to selloffs.
2. **Commodities:** Oil prices can spike due to supply disruptions. Precious metals like gold may rise as investors seek safe havens.
3. **Currencies:** Geopolitical tensions can lead to flight to safety currencies like the US dollar or Swiss franc.

### Game Theory Payoff Matrix (simplified):
Below is a very simplified and hypothetical example:

In this hypothetical matrix, the numbers represent the utility or payoff for each country. Negative values indicate losses, while positive values indicate gains. The higher the number, the better the outcome for the respective country.

Remember, this is a simplified and hypothetical representation. In reality, the outcomes would depend on numerous factors, including diplomatic efforts, military capabilities, and public opinion. Additionally, the moral and ethical considerations of war are not captured in such a matrix.


—————————————GEMINI AI—————————————

Copilot on next Singapore, NY and SF in india


To determine which Indian cities might overtake Singapore’s economy, let’s first consider some key economic indicators from Singapore, New York, and San Francisco:

### Singapore
– **GDP**: Approximately $364.2 billion²
– **GDP per capita**: Around $65,000²
– **Key Sectors**: Finance, trade, manufacturing, and technology⁵

### New York City
– **GDP**: Approximately $1.5 trillion⁶
– **GDP per capita**: Around $76,607⁷
– **Key Sectors**: Finance, media, technology, and real estate⁶

### San Francisco
– **GDP**: Approximately $501 billion[^10^]
– **GDP per capita**: Around $119,000[^10^]
– **Key Sectors**: Technology, finance, and tourism¹¹

### Potential Indian Cities
Based on these indicators, here are some Indian cities that have the potential to match or overtake Singapore’s economy:

1. **Mumbai**: Often called the financial capital of India, Mumbai has a diverse economy with strong sectors in finance, entertainment, and manufacturing. The presence of the Bombay Stock Exchange and numerous multinational corporations boosts its economic profile⁶.

2. **Bangalore**: Known as the Silicon Valley of India, Bangalore is a major tech hub with a strong presence of IT companies and startups. The city’s innovation and technology sector contributes significantly to its economy⁶.

3. **Delhi**: As the capital city, Delhi has a diverse economy with strong sectors in services, manufacturing, and retail. Its strategic location and infrastructure make it a key economic center⁶.

4. **Hyderabad**: With a booming IT sector and a growing pharmaceutical industry, Hyderabad is rapidly emerging as an economic powerhouse. The city’s infrastructure and business-friendly policies attract significant investments⁶.

5. **Chennai**: Known for its automobile industry, Chennai also has strong sectors in IT, healthcare, and manufacturing. Its port facilitates significant trade, boosting the city’s economic profile⁶.

### Skyscrapers and Economic Growth
Skyscrapers are often seen as symbols of economic growth and urban development. While the number of skyscrapers alone doesn’t determine economic success, they can reflect a city’s economic health and attractiveness to businesses. Here are some factors to consider:

1. **Infrastructure Development**: Building skyscrapers requires significant investment in infrastructure, including transportation, utilities, and public services. Indian cities need to enhance their infrastructure to support high-rise buildings.

2. **Business Environment**: A favorable business environment, including ease of doing business, regulatory support, and access to capital, is crucial for attracting investments that lead to skyscraper construction.

3. **Real Estate Market**: A strong real estate market with demand for commercial and residential spaces can drive the construction of skyscrapers. Cities like Mumbai and Bangalore already have a growing number of high-rise buildings due to their robust real estate markets.

4. **Urban Planning**: Effective urban planning and zoning regulations are essential to accommodate skyscrapers without causing congestion and other urban issues.

### Estimating the Number of Skyscrapers
While it’s challenging to provide an exact number of skyscrapers needed, we can look at some benchmarks:

– **Singapore**: Has around 200 skyscrapers¹².
– **New York City**: Has over 300 skyscrapers¹³.
– **San Francisco**: Has around 50 skyscrapers¹⁴.

For Indian cities to match Singapore’s economic profile, they would likely need to develop a similar number of skyscrapers, focusing on creating business districts and commercial hubs that attract global companies.


Singapore’s economic growth over the past 20 years has been driven by several key areas and landmarks:

Marina Bay Sands
Changi Airport
Jurong Island
Biopolis
Gardens by the Bay
Orchard Road
Sentosa
Singapore

These places have collectively contributed to Singapore’s robust economic growth by enhancing tourism, trade, manufacturing, and innovation.

Over the past 20 years, several key places in New York City have significantly contributed to its economic growth:

Midtown Manhattan
Silicon Alley
Hudson Yards, Manhattan
Central Park
Brooklyn
World Trade Center
High Line

Coins : Financial Instruments, Market Bubbles and more

list of notable financial instruments with historic significance:

Goat milk versus cow milk: A comparison

Many people have an allergy to cow milk but can consume goat milk products. This is usually not a lactose intolerance, but a difference in some of the other components.


FOOD FIGHT!! MILK - Cow vs. Goat - Chef's Mandala

Worldwide more people consume goat milk and goat milk products than cow milk and cow milk products. While both milk products have significant benefits, there are situations in which people prefer or choose goat milk. Goats are smaller and consume significantly less feed than cows, making them much easier to keep in developing countries. Milk is considered an important source of calories and nutrition in many developing countries. In many countries other than the United States, goat milk flavor is preferred over cow milk.

Additionally, many people who have an allergy to cow milk can consume goat milk products without experiencing an allergic reaction. This is usually not a lactose intolerance, but a difference in some of the other components like less lactose and different forms of proteins. Michigan State University Extension recommends individuals with dairy intolerance be tested to see if goat milk is right for them if they react to cow milk.

Goat milk (1 cup)

Cow milk (1 cup)

Calories

168 grams

149 grams

Protein

9 grams

8 grams

Fat

10 grams

8 grams

Carbohydrates

11 grams

12 grams

Fiber

0 grams

0 grams

Sugar

11 grams

12 grams

Sodium

122 mg

105 mg

Calcium

327 mg

276 mg

Magnesium

34.2 mg

24.4 mg

Phosphorous

271 mg

205 mg

Potassium

498 mg

322 mg

From USDA

Continue reading “Goat milk versus cow milk: A comparison”